Ping is lying to you - try these instead

I saw a clever little tool on LinkedIn the other week. Someone had written a "ping" in Go that fired HTTP requests instead of ICMP echoes. I sent it over to Zain and we both agreed the idea was great. But writing it in Go felt like a lot of effort for what is, at heart, a loop around curl. So I wrote a Bash version in about ten minutes. Then I wrote one for DNS. Then one for NTP. They all live here now: @simonpainter/network-tools.
Why not just use ping?
ICMP ping is the first thing most of us reach for when something feels slow or broken. It's quick, it's everywhere, and it gives you a number. The trouble is that number tells you about ICMP, and ICMP isn't what your users are actually doing.
A load balancer might happily reply to ICMP while the backend pool is on fire. A firewall might rate-limit or drop ICMP entirely while letting TCP through. A DNS resolver might be reachable but refusing to answer queries. An NTP server might be up but giving you a clock that's drifted. In each case ping says "fine" and the application says "broken".
TCP ping (things like tcping, hping3 -S, or nc -z in a loop) gets you closer. It opens a TCP connection on the right port, so a firewall blocking ICMP can't fool you and a dead listener shows up as a refused connection. That's a real improvement over ICMP. But it stops at the handshake. A successful TCP ping tells you the socket opened. It doesn't tell you the web server returned a 200, the resolver answered NOERROR, or the time source gave you a sane offset. The application layer is still hidden from you.
The fix isn't a cleverer ping. It's pinging with the protocol that actually matters.
Three small tools
Each script does the same thing in spirit: send a request, time it, print a line, repeat. Then on Ctrl+C, print min/avg/max. Just like ping, but speaking a real protocol.
httping
A loop around curl that sends HEAD requests by default and prints the status code and total time.
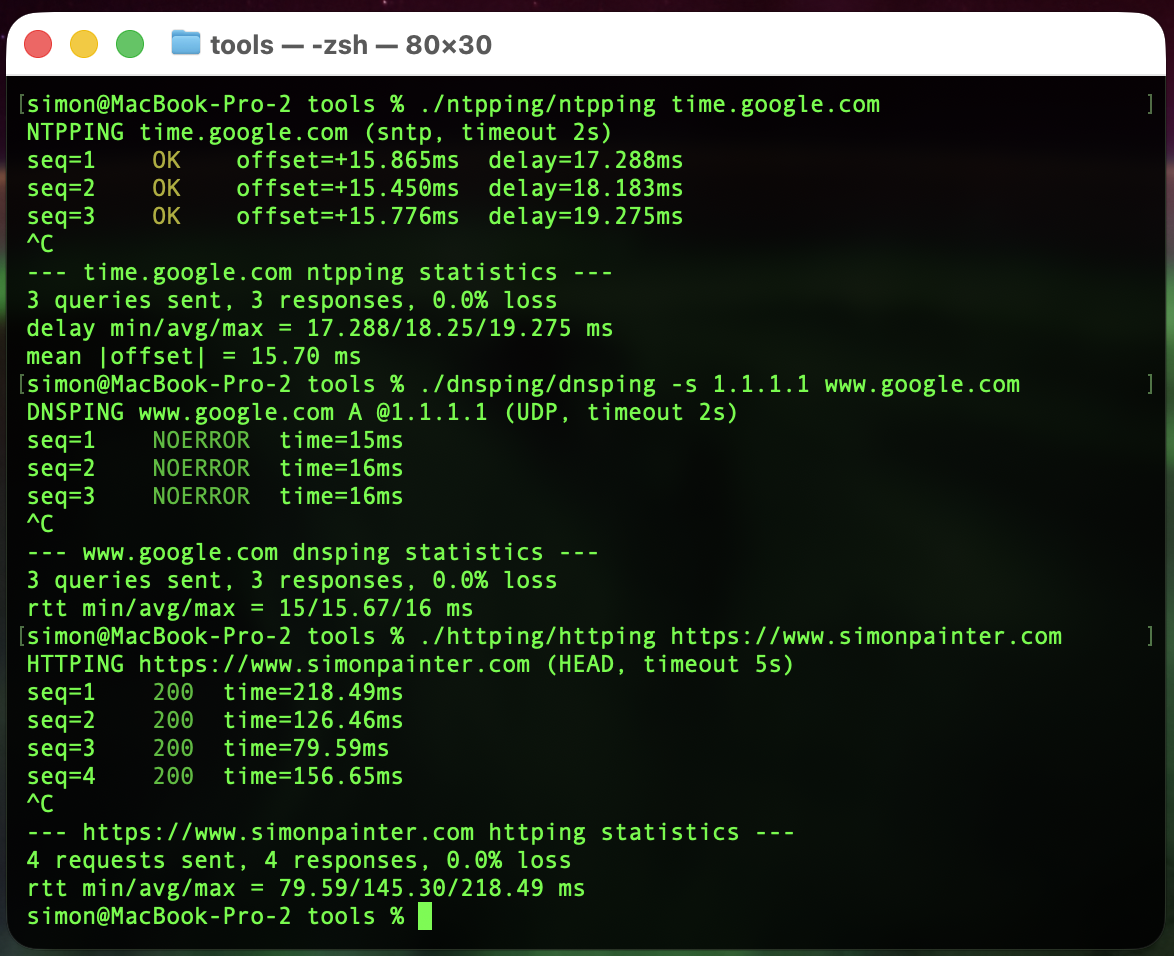
./httping/httping https://www.simonpainter.com
HTTPING https://www.simonpainter.com (HEAD, timeout 5s)
seq=1    200  time=218.49ms
seq=2    200  time=126.46ms
seq=3    200  time=79.59ms
seq=4    200  time=156.65ms
^C
--- https://www.simonpainter.com httping statistics ---
4 requests sent, 4 responses, 0.0% loss
rtt min/avg/max = 79.59/145.30/218.49 ms
There's a -d flag for a detailed breakdown using curl's built-in time_namelookup, time_connect, time_appconnect and time_starttransfer variables, which is handy when you want to see whether the slow bit is DNS, the TCP handshake, TLS, or the server itself.
dnsping
A loop around dig. It sends a query, reads the response code (NOERROR, NXDOMAIN, SERVFAIL...) and the query time dig already prints in its stats line.
./dnsping/dnsping -s 1.1.1.1 www.google.com
DNSPING www.google.com A @1.1.1.1 (UDP, timeout 2s)
seq=1    NOERROR  time=15ms
seq=2    NOERROR  time=16ms
seq=3    NOERROR  time=16ms
^C
--- www.google.com dnsping statistics ---
3 queries sent, 3 responses, 0.0% loss
rtt min/avg/max = 15/15.67/16 ms
You can pick the resolver with -s, the record type with -t, force TCP with -T, or do a reverse lookup with -x. It's the same set of flags dig already gives you, just wrapped in a tighter loop.
ntpping
A loop around sntp. NTP's a bit special because the response carries two useful numbers: the round-trip delay and the offset between your clock and the server's clock.
./ntpping/ntpping time.google.com
NTPPING time.google.com (sntp, timeout 2s)
seq=1   OK      offset=+15.865ms        delay=17.288ms
seq=2   OK      offset=+15.450ms        delay=18.183ms
seq=3   OK      offset=+15.776ms        delay=19.275ms
^C
--- time.google.com ntpping statistics ---
3 queries sent, 3 responses, 0.0% loss
delay min/avg/max = 17.288/18.25/19.275 ms
mean |offset| = 15.70 ms
Lines are colour-coded by the size of the offset, so a server that's drifted is obvious at a glance.
How they're built
There's no magic here. Each script parses its arguments, prints a header, sets a Ctrl+C trap to dump stats, then loops: run the protocol client, parse the response, print a line, update the running min/avg/max, sleep, repeat.
The only bit that changes between tools is the client call. For httping it's curl -w with a format string that asks for the status code and time_total. For dnsping it's dig +stats and a couple of awk lines to pull the status and the "Query time" field. For ntpping it's sntp with -K /dev/null and a regex for the offset and delay.
The maths is done with awk because Bash can't do floating point natively. Stats are kept as plain shell variables and updated each iteration. The whole thing is under 200 lines per tool.
That's really the point. The hard work has already been done by curl, dig and sntp. They speak the protocols, handle TLS, retries, IPv6, all of it. Wrapping them in a while loop with a stats trap is a tiny amount of code for a tool you'll actually use.
Where I think I will find them useful
I'm slap bang in the middle of a datacentre migration right now. The team is all over the application migrations but pretty soon the network part is going to get very noisy. Moving essential services like DNS, NTP and load balancers is always a bit nerve wracking and watching the pings is sometimes the only thing you can do.
Server and load balancer migrations
When you're cutting traffic over to a new pool, ICMP tells you nothing useful. The old VIP and the new VIP both reply to pings whether the backend is healthy or not. httping against the actual health endpoint, run from a few different vantage points, gives you a real signal. You can leave it running through the change window and watch the status codes flip.
The -d flag is a quiet hero here. If response times jump after a cutover, the breakdown tells you whether it's DNS pointing at a stale record, a slow TLS handshake on a new certificate, or the application itself taking longer to respond.
DNS migrations
Moving authoritative DNS, swapping resolvers, or rolling out a new DNS firewall? Point dnsping at the old server and the new one in two terminal panes and watch them side by side. You'll see propagation as it happens, spot any SERVFAIL responses the moment they appear, and get a feel for the latency difference between resolvers without having to script anything.
It's also brilliant for catching the resolver that's silently truncating responses. Force TCP with -T and compare the times.
NTP migrations
NTP is the protocol nobody thinks about until clocks drift and Kerberos breaks. ntpping lets you quickly verify a new time source before you point production at it. If the offset is bouncing around or the delay is wildly variable, that server isn't ready to be a stratum source for anything that matters.
It's also handy when you're moving workloads between regions or clouds and want to confirm the local NTP service is actually local and not a few hundred milliseconds away.
Latency testing with the real protocol
This is the use case that started the whole thing. ICMP latency and application latency are not the same number. A path that's 5ms on ping can easily be 50ms on HTTPS once you add the TCP handshake, TLS negotiation and a server that's slow to respond. httping gives you the number your users actually experience. dnsping gives you the number that determines whether your page loads quickly. ntpping gives you the number that decides whether your distributed system stays in sync.
If you're measuring latency for an SLA, a capacity plan or a migration sign-off, measure it with the protocol the application uses. Not ICMP.
Try them
The repo is at @simonpainter/network-tools. They're plain Bash, MIT licensed, and need only curl, dig and sntp which you almost certainly already have. Clone it, drop the scripts on your PATH, and the next time someone says "the network is slow" you'll have something better than ping to point at the problem.